

Discover how automated network diagram software simplifies network mapping, visualizes device relationships, and keeps complex infrastructure clear and up to date.
Introduction
Modern networks change too quickly for static diagrams. New switches, links, devices, and configurations can make manually maintained network maps outdated before teams finish updating them.
Automated network diagram software helps solve this problem by turning network data into structured visual topologies. It gives IT teams a faster way to understand devices, connections, layers, and dependencies.
What Is Automated Network Diagram Software and Why Does It Matter?
Automated network diagram software creates network topology maps with less manual drawing. It uses network or hardware data to identify devices, connections, roles, and infrastructure relationships.
Leading tools focus heavily on automatic discovery, topology updates, network visibility, and easier troubleshooting. These capabilities help teams maintain useful documentation as infrastructure changes.
A good solution should do more than place device icons on a canvas. It should help network engineers understand how infrastructure is structured and how important components depend on each other.
Why Manual Network Diagramming Breaks Down in Modern Networks?
Manual network diagrams require engineers to collect information, position devices, draw links, label connections, and repeatedly check whether the design still matches the actual environment.
This approach becomes difficult when networks contain multiple sites, vendors, high-availability pairs, device stacks, redundant connections, and several architectural layers.
Common problems include:
- ❌ Network diagrams become outdated after infrastructure changes.
- ❌ Engineers spend valuable time moving nodes and fixing connections.
- ❌ Complex dependencies may be missed during manual documentation.
- ❌ Inconsistent layouts make large networks harder to understand.
- ❌ Design mistakes can reach deployment before being noticed.
Outdated documentation also slows troubleshooting and planning. Engineers may spend extra time verifying the network instead of using the diagram as a reliable source of architectural information.
How Automated Network Diagramming Solves the Problem
Automation reduces the repetitive work involved in turning network information into diagrams. The software analyzes available infrastructure data and builds connections based on detected or defined relationships.
Some tools mainly discover devices and map existing networks. More advanced platforms can also apply architectural logic when deciding where devices belong and how relationships should appear.
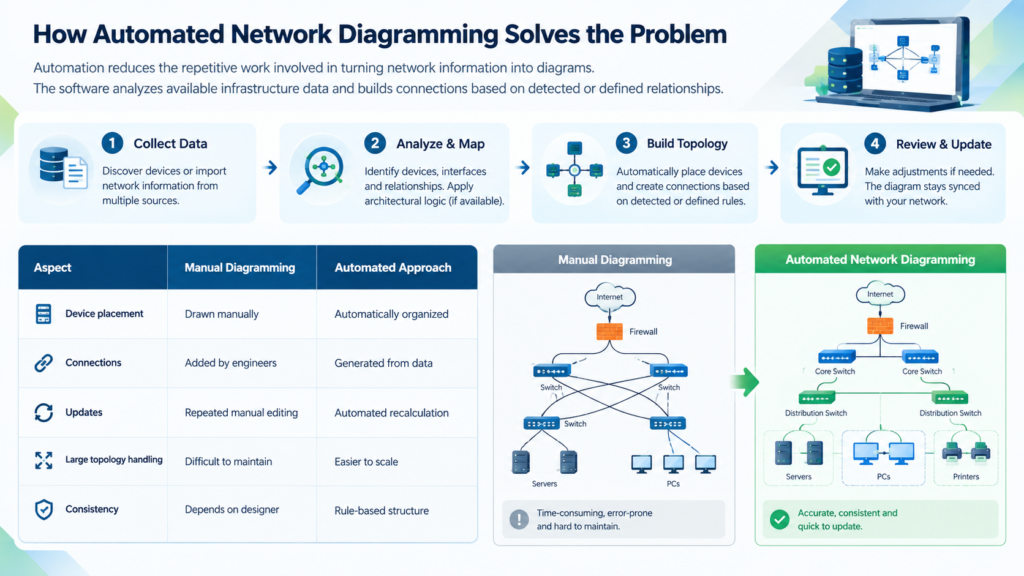
| Aspect | Manual Diagramming | Automated Approach |
| Device placement | Drawn manually | Automatically organized |
| Connections | Added by engineers | Generated from data |
| Updates | Repeated manual editing | Automated recalculation |
| Large topology handling | Difficult to maintain | Easier to scale |
| Consistency | Depends on designer | Rule-based structure |
The biggest advantage is not simply drawing faster. Automation reduces repetitive work while creating a more consistent foundation for planning, documentation, troubleshooting, and infrastructure changes.
Synapse Grid – An Automated Network Diagram Software Solution
Synapse Grid approaches network diagramming as an architecture problem instead of only a drawing problem. It converts hardware information into structured, logically consistent network topologies.
Its AI-powered engine can identify relationships between devices and map high-availability links, redundancy paths, stacks, and logical dependencies. This gives diagrams more architectural context.
Key capabilities include:
- Logic-Aware Discovery: Maps HA links, redundancy paths, and logical dependencies.
- Multi-Vendor Fingerprinting: Assigns device roles, icons, and layers from hardware capabilities.
- Dynamic Hierarchy: Organizes nodes into WAN, Edge, Core, Distribution, and Access layers.
- HA Boundary Logic: Groups high-availability clusters into logical boundaries.
- Smart Cable Snapping: Connects links to relevant logical ports more cleanly.
- Real-Time Vector Ingestion: Recalculates topology layouts as data changes.
- One-Click Export: Produces documentation-ready PDF and SVG diagrams.
For example, a network containing redundant core switches, access switches, firewalls, WAN devices, and multiple vendors does not need to be arranged node by node.
Synapse Grid can analyze the inventory, determine device roles and relationships, organize architectural layers, map connections, and create a structured topology automatically.
How Synapse Grid Works
Synapse Grid uses a four-stage synthesis lifecycle: Inventory, Correlation, Synthesis, and Export. Each stage removes repetitive work normally required for network documentation.
Step 1: Add the Network Inventory
Start by providing hardware information. Synapse Grid supports CSV inventory input and manual vendor-count selection across operational layers.
The CogniKor site also states that network specifications, device information, existing diagrams, and even hand-drawn sketches can be turned into network designs.
Step 2: Correlate Devices and Relationships
The engine analyzes the supplied data to find important infrastructure relationships. It can identify HA pairs, stack members, redundancy paths, and logical boundaries.
This logic-aware approach helps prevent the output from becoming a simple collection of connected icons without meaningful architectural organization.
Step 3: Generate and Export the Topology
Synapse Grid synthesizes the information into an automatically arranged topology with device placement and connection mapping.
The finished design can then be exported as PDF, SVG, PNG, or JPEG for architecture reviews, HLD/LLD documentation, implementation planning, or internal records.
Synapse Grid vs Traditional Network Diagram Approaches
Different tools solve different parts of network mapping. Standard discovery platforms are strong at finding existing devices, while Synapse Grid adds architecture-focused synthesis and logical relationship mapping.
| Capability | Synapse Grid | Manual Diagram Tool | Standard Auto-Mapper |
| Automatic topology generation | ✅ | ❌ | ✅ |
| Architecture-aware device roles | ✅ | Manual | Varies |
| HA and redundancy logic | ✅ | Manual | Varies |
| Automatic layer positioning | ✅ | ❌ | Varies |
| Multi-vendor fingerprinting | ✅ | ❌ | Varies |
| Dynamic path recalculation | ✅ | ❌ | Varies |
| Documentation export | ✅ | Usually | Usually |
Traditional mapping products such as SolarWinds, Auvik, N-able, and Tufin emphasize automatic discovery, network scanning, changing topology visibility, and infrastructure monitoring.
Synapse Grid differentiates itself by focusing on converting hardware and network information into production-ready architecture while preserving logical context around roles, HA structures, layers, and dependencies.
Benefits of Automated Network Diagram Software
Automation can remove hours of repetitive diagram editing while giving engineers a clearer and more consistent view of complex infrastructure.
Save Significant Design Time
CogniKor states that Synapse Grid can generate network designs in under two minutes, compared with a claimed three to ten days for manual design workflows.
That speed can be valuable during infrastructure planning, hardware upgrades, architecture reviews, migrations, and projects where multiple design versions must be produced.
Reduce Cabling and Design Errors
CogniKor also reports a near-zero cabling error rate, compared with a stated manual rate of 0–25% for the workflows it targets.
Automated relationship mapping and logical port connections can help teams detect design problems before those errors become physical deployment problems.
Improve Network Documentation
A topology becomes more useful when engineers can clearly identify device roles, architectural layers, HA groups, connection types, and logical dependencies.
Synapse Grid adds these relationships directly to the design, making network documentation easier to interpret during planning, troubleshooting, reviews, and handovers.FAQ’s
Turn Network Complexity Into Clear Architecture
Automated network diagram software should eliminate repetitive drawing without removing the architectural intelligence engineers need. The goal is a diagram that is faster to create and easier to trust.
Synapse Grid combines AI-assisted topology generation with logic-aware relationships, HA mapping, multi-vendor identification, automatic hierarchy, and scalable network design.
Instead of spending days manually arranging infrastructure, teams can turn network information into structured, documentation-ready designs and focus more time on architecture and implementation.
For larger or more complex environments, teams can also review Synapse Grid with CogniKor to see how it fits their existing design, documentation, and network architecture workflow.
FAQ’s
Automated network diagram software turns network or infrastructure information into visual topology diagrams. It reduces the need to manually place devices and draw every connection.
It depends on the platform. Synapse Grid specifically supports multi-vendor fingerprinting and lists Cisco, Fortinet, HPE Aruba, Huawei, and other environments among its supported use cases.
Yes. Synapse Grid can export topology designs in PDF, SVG, PNG, and JPEG formats, allowing teams to use the output in technical documentation and architecture workflows.
Conclusion
Automated network diagram software makes it easier to understand, manage, and document complex network environments. Instead of relying on manual diagrams that quickly become outdated, teams can create clearer network views and reduce time spent maintaining documentation.
Solutions like Synapse Grid can also help teams visualize device roles, logical relationships, dependencies, redundant paths, stacks, and high-availability connections. This gives IT teams a more complete view of how the network is structured and makes troubleshooting, planning, and infrastructure management more efficient.