

Explore network connection mapping, common connectivity errors, link relationships, and how Synapse Grid creates clearer network connection diagrams.
Introduction
A network diagram may show every switch, router, and firewall, yet still leave engineers with one important question: which devices are actually connected, and how do those connections work together?
Consider a network with 50 switches. Each device may have multiple uplinks, backup connections, and management interfaces. Drawing a line between two devices is easy.
Representing the correct relationship between them is much harder.
This is where network connection mapping becomes important. It turns individual device links into an understandable picture of network connectivity.
For large enterprise environments, Synapse Grid helps organize those relationships through AI-assisted connection mapping, logical port alignment, and structured topology visualization.
The Hidden Complexity Behind a Simple Network Link
A connection between two devices is rarely just a line on a diagram.
One switch might connect directly to another through fiber, while its management traffic uses a separate interface. The same switch could also have a secondary connection to a redundant core device.
If all three links look identical, the diagram hides useful technical information.
A meaningful connection map should answer several questions:
- Where does each connection begin and end?
- Which links provide primary and alternative connectivity?
- Are connected devices part of the same logical group?
- What type of connection does each line represent?
- Are important device dependencies visible?
These details turn a basic drawing into useful network documentation.
When a Network Connection Diagram Becomes Misleading
An incomplete or poorly organized diagram can create more confusion than having no diagram at all.
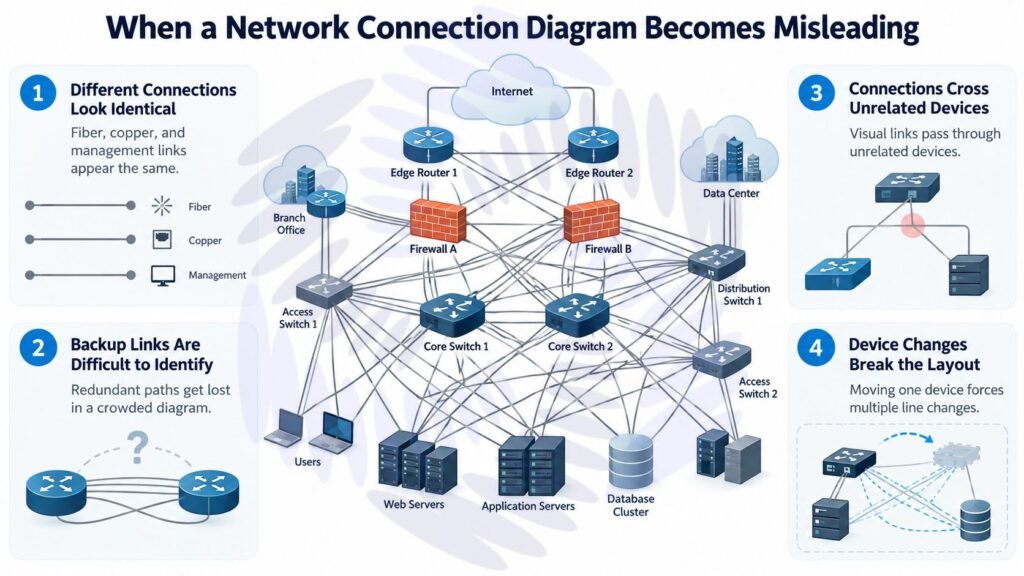
Problem 1: Different Connections Look Identical
A fiber uplink, copper connection, and management link may appear as ordinary lines.
Without clear labels or visual distinctions, engineers must investigate the meaning of each connection separately.
Problem 2: Backup Links Are Difficult to Identify
Redundant connections are essential for resilient network designs. However, when a diagram contains hundreds of overlapping lines, alternative paths can become difficult to recognize.
Problem 3: Connections Cross Unrelated Devices
Poor diagram layouts sometimes route visual links through unrelated network components, making connectivity appear more complicated than it actually is.
Problem 4: Device Changes Break the Layout
Moving a device in a manually created diagram can require repositioning several connection lines.
This creates unnecessary maintenance work and increases the chance of documentation errors.
What Information Belongs in a Network Connection Map?
Not every detail needs to appear on the same diagram. Engineers should prioritize information that explains how devices are related.
| Mapping Element | Information to Show | Why It Matters |
| Source Device | Device where the connection begins | Establishes the connection origin |
| Destination Device | Connected device or endpoint | Clarifies the relationship |
| Interface | Relevant network port | Supports connection verification |
| Link Type | Fiber, copper, MPLS, or management | Distinguishes connectivity |
| Redundancy | Primary or alternative path | Explains resilience |
| Logical Group | HA pair, stack, or network layer | Adds architectural context |
This information should be based on available network records and verified wherever necessary.
The purpose is not to include every device specification. It is to make each important connection understandable.
Connection Mapping Across Core, Distribution, and Access Layers
Imagine a network where access switches connect to distribution switches, which then connect to core devices.
A flat diagram might display all equipment side by side. Although the connections exist visually, their architectural significance remains unclear.
A layered connection map presents the relationships differently.
- Core layer: Shows high-capacity connections between backbone devices.
- Distribution layer: Illustrates aggregation relationships and redundant uplinks.
- Access layer: Shows how downstream switches connect to the larger infrastructure.
- This arrangement makes it easier to distinguish backbone connectivity from access-level connections.
Synapse Grid supports hierarchical node organization and automatically arranges devices into relevant architectural layers.
A Practical Connection Mapping Scenario
Consider an office network with the following infrastructure:
- 2 core switches
- 4 distribution switches
- 12 access switches
- 2 firewalls
- 2 WAN connections
The engineering team needs to document connectivity before making infrastructure changes.
A useful mapping approach would be:
- Start with the core relationships: Identify which distribution switches connect to each core switch.
- Show alternative uplinks: Where redundancy is configured, represent the backup relationships separately from ordinary single connections.
- Add downstream connectivity: Connect access switches to their appropriate distribution devices.
- Separate external connections: Show WAN and firewall relationships without mixing them with internal switch connectivity.
- Review the resulting paths: Confirm that the diagram reflects the intended architecture.
The result should explain how the network fits together without forcing engineers to trace dozens of unrelated lines.
How Synapse Grid Handles Complex Connection Relationships?
Synapse Grid approaches connection mapping as part of network architecture generation rather than simply drawing links between icons.
Its mapping-related functionality includes several useful mechanisms.
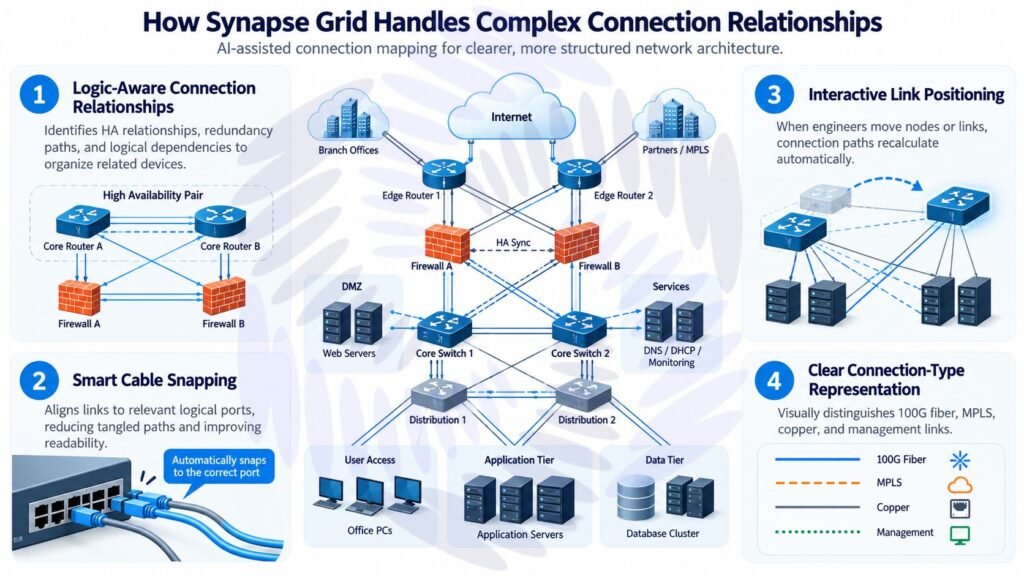
Logic-Aware Connection Relationships
Synapse Grid identifies high-availability relationships, redundancy paths, and logical dependencies from supported network information.
This helps organize related devices within the generated architecture.
Smart Cable Snapping
Instead of leaving links loosely attached to diagram objects, Smart Cable Snapping aligns connections with relevant logical ports.
This reduces tangled connections and improves diagram readability.
Interactive Link Positioning
When engineers modify nodes or links, Synapse Grid recalculates connection paths.
This is useful when rearranging a large diagram because the visual relationships can adapt to layout changes.
Clear Connection-Type Representation
Synapse Grid visually distinguishes connection categories such as 100G fiber, MPLS, copper, and management links.
That distinction helps engineers interpret a connection map without treating every link as equivalent.
Network Connection Mapping Mistakes That Engineers Should Check
Even a well-presented diagram needs technical review.
| Common Mistake | Possible Consequence | Recommended Check |
| Incorrect endpoint | Misleading device relationship | Verify source and destination |
| Missing backup link | Incomplete redundancy picture | Check alternative paths |
| Unclear port association | Connection ambiguity | Review interface details |
| Mixed link types | Difficult diagram interpretation | Apply consistent link labels |
| Outdated connection record | Incorrect planning assumptions | Review current infrastructure data |
A visually attractive diagram is not automatically an accurate one.
Engineers should distinguish verified connections from inferred relationships and review the underlying information before using diagrams for implementation.
Where Connection Mapping Adds the Most Value?
Connection mapping is particularly useful when teams need to understand relationships rather than investigate isolated devices.
Three common situations include:
- Infrastructure expansion: Before connecting new distribution equipment, engineers can review existing uplinks and architectural relationships.
- Redundancy planning: Teams can identify where multiple connections are intended to provide alternative paths.
- Network documentation handover: A clearly labeled diagram helps another engineer understand the device relationships without reconstructing the entire architecture.
For these activities, a clear connection map serves as a shared technical reference.
FAQ’s
It represents relationships such as device dependencies, logical groupings, and connectivity paths rather than only physical cables.
It uses logic-aware relationships, Smart Cable Snapping, and interactive path recalculation.
Yes. They provide a reference for understanding existing relationships before modifying network infrastructure.
Yes. Engineers should check that input information and generated relationships match the intended network architecture.
Yes. It supports PDF, SVG, PNG, and JPEG outputs for network documentation.
Conclusion
A useful network diagram does more than display equipment. It explains the relationships that make network communication possible.
Network connection mapping helps engineers distinguish link types, understand redundancy, organize device relationships, and create clearer infrastructure documentation.
Synapse Grid brings these relationships into structured diagrams through AI-assisted mapping, logical connection organization, and interactive link visualization.
For engineering teams working with complex network architectures, the goal is simple: make every important connection easier to understand.
Explore Synapse Grid by CogniKor for intelligent network connection mapping